This printed article is located at http://hemraj.listedcompany.com/highlights.html
Financial Highlights
Key Financial Figures
(Million Baht)
| 2011 | 2012 | 2013 | 2014 | 2015 | |
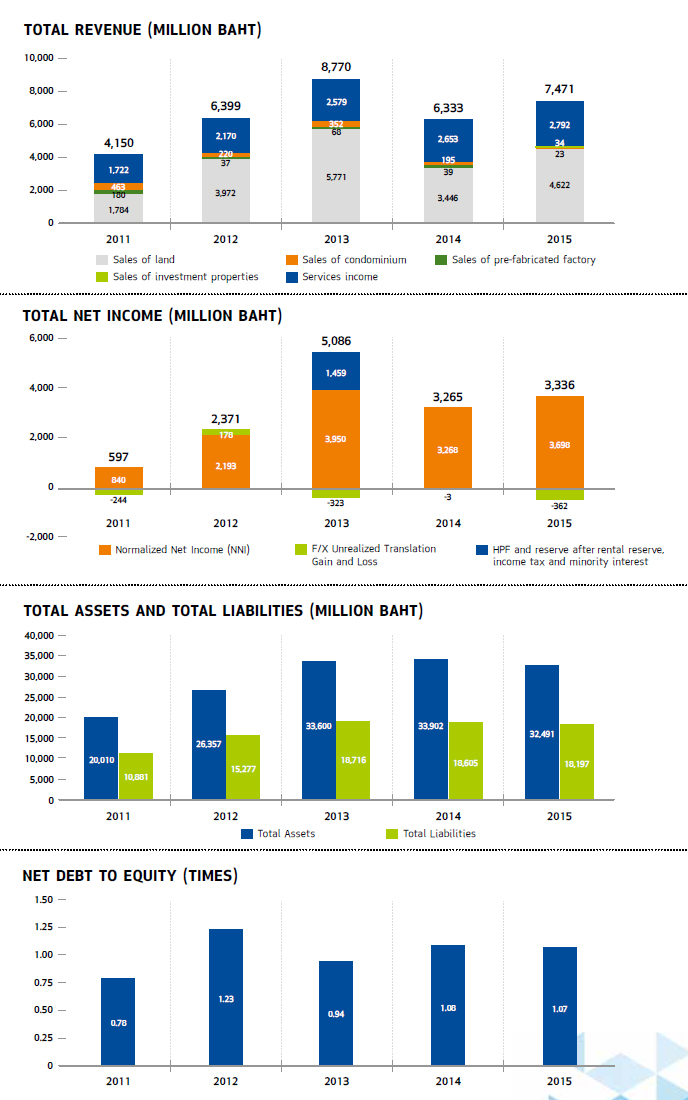
| Total Revenue | 4,150 | 6,399 | 8,770 | 6,333 | 7,471 |
| Sales of land | 1,784 | 3,972 | 5,771 | 3,446 | 4,622 |
| Sales of pre-fabricated factory | 180 | 37 | 68 | 39 | - |
| Sales of condominium | 463 | 220 | 352 | 195 | 23 |
| Sales of investment properties | - | - | - | - | 34 |
| Services income | 1,722 | 2,170 | 2,579 | 2,653 | 2,792 |
| Net Income | 597 | 2,371 | 5,086 | 3,265 | 3,336 |
| Cash and cash equivalent | 3,718 | 1,694 | 4,780 | 2,087 | 2,936 |
| Total Assets | 20,010 | 26,357 | 33,600 | 33,902 | 32,491 |
| Total Debts/Loans | 8,462 | 10,741 | 13,899 | 15,531 | 14,907 |
| Total Liabilities | 10,881 | 15,277 | 18,716 | 18,605 | 18,197 |
| Total Shareholder’s Equity | 9,129 | 11,080 | 14,884 | 15,297 | 14,295 |
| Earning Per Share (Baht) | 0.06 | 0.24 | 0.45 | 0.31 | 0.34 |
| Par (Baht) | 0.40 | 0.40 | 0.40 | 0.40 | 0.40 |
Key Financial Ratios
| 2011 | 2012 | 2013 | 2014 | 2015 | |
| Current Ratio (Times) | 4.95 | 2.34 | 3.51 | 3.61 | 4.01 |
| Net Debt to Equity (Times) | 0.78 | 1.23 | 0.94 | 1.08 | 1.07 |
| Return on Assets | 3.1% | 10.2% | 17.0% | 9.7% | 10.0% |
| Return on Equity | 5.9% | 23.7% | 36.2% | 19.9% | 22.2% |
| Net Profit Margin | 13.8% | 36.0% | 37.6% | 51.6% | 44.6% |
| Earnings per Share (Baht) | 0.06 | 0.24 | 0.45 | 0.31 | 0.34 |
| Book Value per Share (Baht) | 0.94 | 1.14 | 1.53 | 1.58 | 1.47 |
| No. of Shares Issued and Paid (Million Shares) | 9,705 | 9,705 | 9,705 | 9,705 | 9,705 |